 CAIN Web Service
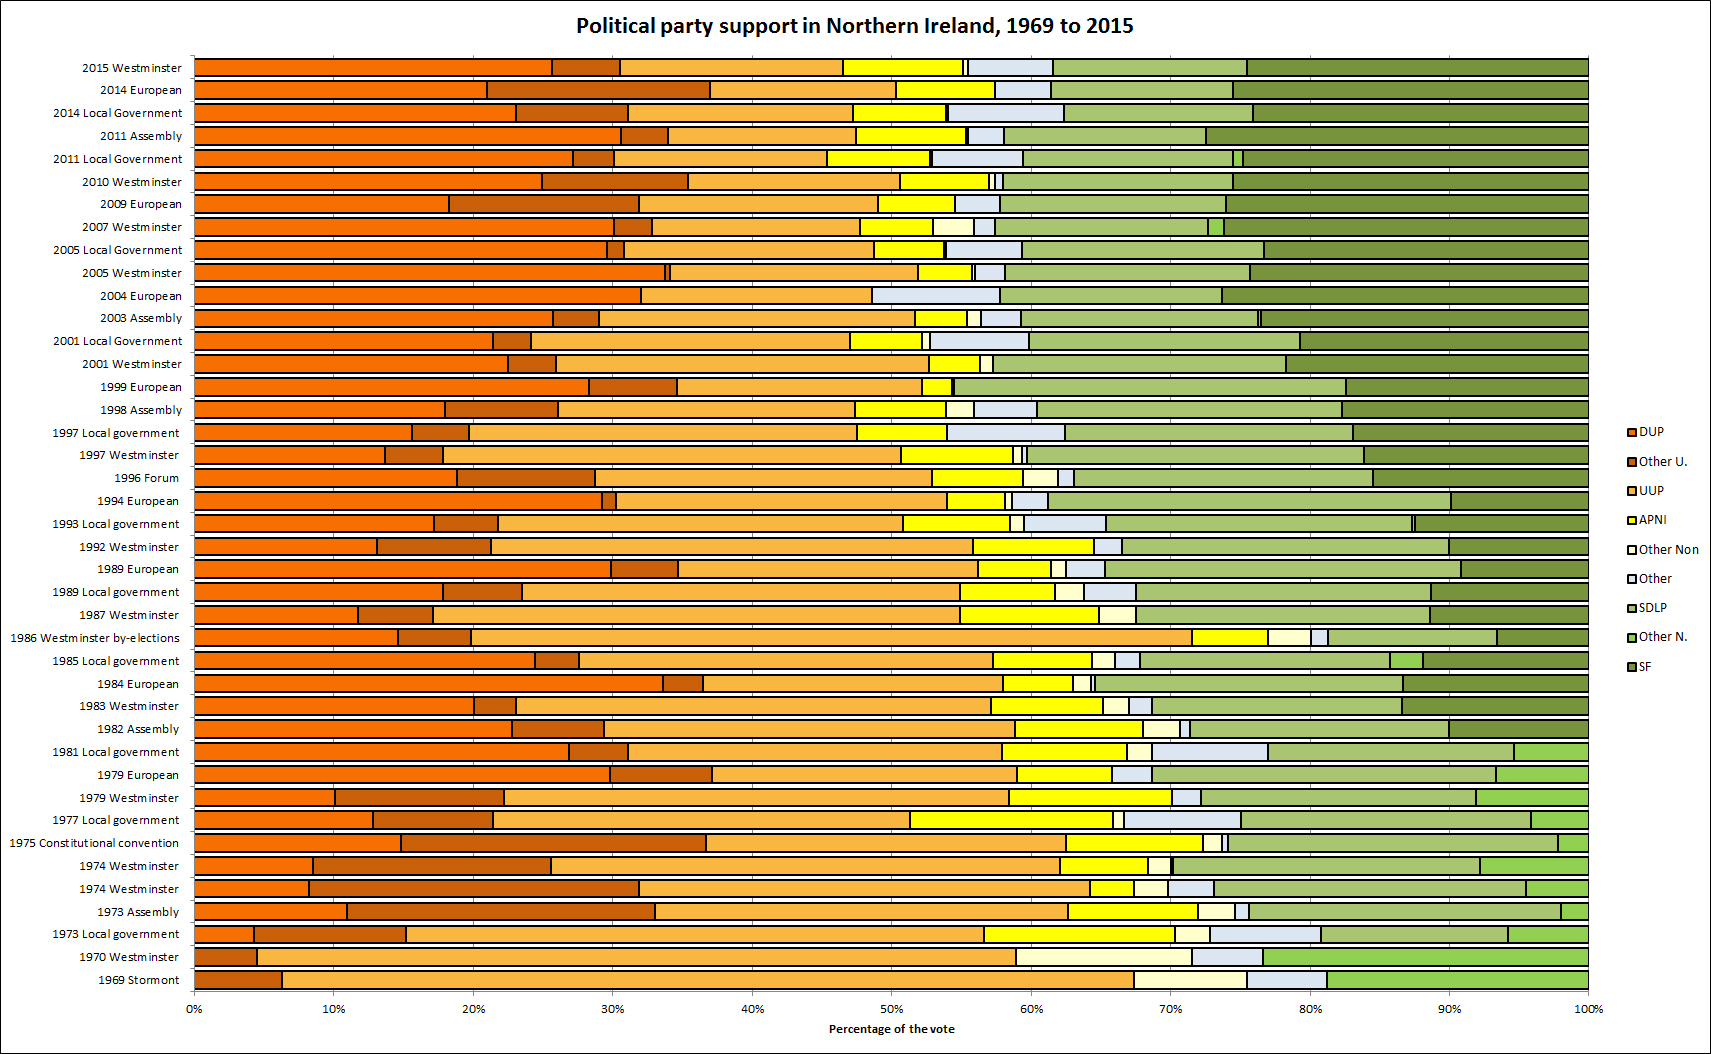
Political party support in Northern Ireland, 1969 to 2015
[CAIN_Home]
[Key_Events]
[KEY_ISSUES]
[Conflict_Background]
POLITICS:
[Menu]
[Reading]
[Articles]
[Government]
[Political_Initiatives]
[Political_Solutions]
[Parties]
[Elections]
[Polls]
[Sources]
[Peace_Process]
Page Compiled: Martin Melaugh
Material is added to this site on a regular basis - information on this page may change
Political party support in Northern Ireland, 1969 to 2015
| Election |
Total Unionist |
Total Nationalist |
Unionist bloc |
Nationalist bloc |
Non confessional |
Other |
| |
|
|
UUP |
DUP |
Other U. |
SDLP |
SF |
Other N. |
APNI |
Other Non |
|
|
1969 Stormont |
67.4 |
18.8 |
61.1 |
- |
6.3 |
- |
- |
18.8 |
- |
8.1 |
5.7 |
|
1970 Westminster |
58.8 |
23.3 |
54.3 |
- |
4.5 |
- |
- |
23.3 |
- |
12.6 |
5.1 |
|
1973 Local government |
56.6 |
19.2 |
41.4 |
4.3 |
10.9 |
13.4 |
- |
5.8 |
13.7 |
2.5 |
8.0 |
|
1973 Assembly |
61.9 |
24.1 |
29.3 |
10.8 |
21.8 |
22.1 |
- |
2.0 |
9.2 |
2.6 |
1.0 |
|
1974 Westminster |
64.2 |
26.9 |
32.3 |
8.2 |
23.7 |
22.4 |
- |
4.5 |
3.2 |
2.4 |
3.3 |
|
1974 Westminster |
62.1 |
29.8 |
36.5 |
8.5 |
17.1 |
22.0 |
- |
7.8 |
6.3 |
1.6 |
0.2 |
|
1975 Constitutional convention |
62.5 |
25.9 |
25.8 |
14.8 |
21.9 |
23.7 |
- |
2.2 |
9.8 |
1.4 |
0.4 |
|
1977 Local government |
50.8 |
24.7 |
29.6 |
12.7 |
8.5 |
20.6 |
- |
4.1 |
14.4 |
0.8 |
8.3 |
|
1979 Westminster |
59.0 |
28.1 |
36.6 |
10.2 |
12.2 |
19.9 |
- |
8.2 |
11.8 |
- |
2.1 |
|
1979 European |
59.0 |
31.3 |
21.9 |
29.8 |
7.3 |
24.6 |
- |
6.7 |
6.8 |
- |
2.9 |
|
1981 Local government |
57.3 |
22.8 |
26.5 |
26.6 |
4.2 |
17.5 |
- |
5.3 |
8.9 |
1.8 |
8.2 |
|
1982 Assembly |
59.4 |
28.9 |
29.7 |
23.0 |
6.7 |
18.8 |
10.1 |
- |
9.3 |
2.7 |
0.7 |
|
1983 Westminster |
57.0 |
31.3 |
34.0 |
20.0 |
3.0 |
17.9 |
13.4 |
- |
8.0 |
1.9 |
1.6 |
|
1984 European |
58.0 |
35.4 |
21.5 |
33.6 |
2.9 |
22.1 |
13.3 |
- |
5.0 |
1.3 |
0.3 |
|
1985 Local government |
56.9 |
32.0 |
29.5 |
24.3 |
3.1 |
17.8 |
11.8 |
2.4 |
7.1 |
1.6 |
1.8 |
|
1986 Westminster by-elections |
71.5 |
18.7 |
51.7 |
14.6 |
5.2 |
12.1 |
6.6 |
- |
5.5 |
3.1 |
1.2 |
|
1987 Westminster |
54.9 |
32.5 |
37.8 |
11.7 |
5.4 |
21.1 |
11.4 |
- |
10.0 |
2.6 |
- |
|
1989 Local government |
54.9 |
32.5 |
31.4 |
17.8 |
5.7 |
21.2 |
11.3 |
- |
6.8 |
2.1 |
3.7 |
|
1989 European |
56.2 |
34.7 |
21.5 |
29.9 |
4.8 |
25.5 |
9.2 |
- |
5.2 |
1.1 |
2.8 |
|
1992 Westminster |
55.8 |
33.5 |
34.5 |
13.1 |
8.2 |
23.5 |
10.0 |
- |
8.7 |
- |
2.0 |
|
1993 Local government |
50.8 |
34.6 |
29.0 |
17.2 |
4.6 |
21.9 |
12.5 |
0.2 |
7.7 |
1.0 |
5.9 |
|
1994 European |
54.0 |
38.8 |
23.8 |
29.2 |
1.0 |
28.9 |
9.9 |
- |
4.1 |
0.5 |
2.6 |
|
1996 Forum |
52.9 |
36.9 |
24.2 |
18.8 |
9.9 |
21.4 |
15.5 |
- |
6.5 |
2.5 |
1.2 |
|
1997 Westminster |
50.5 |
40.2 |
32.7 |
13.6 |
4.2 |
24.1 |
16.1 |
- |
8.0 |
0.7 |
0.3 |
|
1997 Local government |
47.5 |
37.6 |
27.8 |
15.6 |
4.1 |
20.7 |
16.9 |
- |
6.5 |
- |
8.4 |
|
1998 Assembly |
47.4 |
39.6 |
21.3 |
18.0 |
8.1 |
21.9 |
17.7 |
- |
6.5 |
2.0 |
4.5 |
|
1999 European |
52.2 |
45.5 |
17.6 |
28.3 |
6.3 |
28.1 |
17.4 |
- |
2.1 |
- |
0.2 |
|
2001 Westminster |
52.7 |
42.7 |
26.8 |
22.5 |
3.4 |
21.0 |
21.7 |
- |
3.6 |
1.0 |
- |
|
2001 Local Government |
47.0 |
40.1 |
22.9 |
21.4 |
2.7 |
19.4 |
20.7 |
- |
5.1 |
0.6 |
7.1 |
|
2003 Assembly |
51.7 |
40.7 |
22.7 |
25.7 |
3.3 |
17.0 |
23.5 |
0.2 |
3.7 |
1.0 |
2.9 |
|
2004 European |
48.6 |
42.2 |
16.6 |
32.0 |
- |
15.9 |
26.3 |
- |
- |
- |
9.2 |
|
2005 Westminster |
51.8 |
41.8 |
17.7 |
33.7 |
0.4 |
17.5 |
24.3 |
- |
3.9 |
0.2 |
2.2 |
|
2005 Local Government |
48.8 |
40.7 |
18.0 |
29.6 |
1.2 |
17.4 |
23.3 |
- |
5.0 |
0.2 |
5.4 |
| 2007 Assembly |
47.74 |
42.56 |
14.94 |
30.09 |
2.71 |
15.22 |
26.16 |
1.18 |
5.24 |
2.91 |
1.56 |
| 2009 European |
49.00 |
42.24 |
17.11 |
18.23 |
13.66 |
16.20 |
26.04 |
- |
5.51 |
- |
3.25 |
| 2010 Westminster |
50.60 |
41.98 |
15.19 |
24.96 |
10.45 |
16.47 |
25.52 |
- |
6.35 |
0..44 |
0.63 |
2011 Local Government |
45.34 |
40.58 |
15.23 |
27.16 |
2.95 |
15.04 |
24.78 |
0.76 |
7.40 |
0.12 |
6.56 |
| 2011 Assembly |
47.46 |
41.97 |
13.48 |
30.57 |
3.41 |
14.52 |
27.45 |
- |
7.84 |
0.18 |
2.55 |
| 2014 Local Government |
- |
- |
16.15 |
23.09 |
8.02 |
13.58 |
24.07 |
|
6.65 |
0.16 |
8.28 |
| 2014 European |
50.32 |
38.55 |
13.33 |
20.95 |
16.04 |
13.03 |
25.52 |
- |
7.10 |
- |
4.04 |
| 2015 Westminster |
46.52%
334,057 |
38.44%
276,041 |
16.01 |
25.66 |
4.85 |
13.90 |
24.54 |
- |
8.57 |
0.38 |
6.09 |
| |
|
|
UUP |
DUP |
Other U. |
SDLP |
SF |
Other N. |
APNI |
Other Non |
|
| Election |
Total Unionist |
Total Nationalist |
Unionist bloc |
Nationalist bloc |
Non confessional |
Other |
See also:
Chart based on the above table
Notes:
UUP - Ulster Unionist Party
DUP - Democratic Unionist Party
Other U. - Other Unionist
SDLP - Social Democratic and Labour Party
SF - Sinn Féin
Other N. - Other Nationalist
APNI - Aliance Party of Northern Ireland
Other Non - Other Non-confessional parties
Other - Other parties and independent candidates
- The table was initially based on: McGarry, J. and O'Leary, B. (eds) (1990) The Future of Northern Ireland. Oxford: Claredon Press.
- The results of the most recent elections are based on media reports. All these figures should be treated as provisional.
- The most meaningful comparisons are those between similar types of elections, for example when comparing Westminster elections.
- The 1986 Westminster by-elections were held in protest against the Anglo-Irish Agreement. 15 seats were contested and one of the Unionist seats was lost to the SDLP.
|