CAIN Web Service
Background Information on Northern Ireland Society - Agriculture
[CAIN_Home]
[Key_Events]
Key_Issues]
[Conflict_Background]
NI SOCIETY:
[Agriculture]
[Art_&_Literature]
[Culture]
[Economy]
[Education]
[Employment]
[Geography]
[History]
[Housing]
[Income]
[Law_&_Order]
[Media]
[Politics]
[Population]
[Religion]
[Security]
[Tourism]
[Transportation]
Text and Research: Fionnuala McKenna
Material is added to this site on a regular basis - information on this page may change
Agriculture in Northern Ireland
The information below refers mainly to the 1990s.
Agriculture is an important industry in Northern Ireland. In 1998 it provided
employment for approximately 60,000 people, and was worth more than £1
billion per year to the economy. In 1994, Northern Ireland derived
a greater percentage of its GDP from agriculture than almost any
other region in the UK (the one exception being East Anglia).
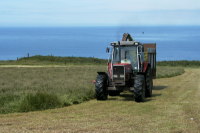
In the 1990s the number of farms in Northern Ireland decreased, whilst the size of farms actually increased.
This trend was similar to the rest of Ireland, where smaller farmers
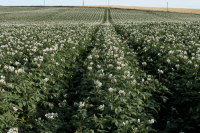
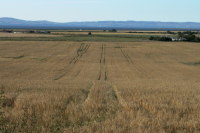
were squeezed out of the market and the average farm grew to over 100 acres. A huge proportion (78.8%) of land in Northern
Ireland was under cultivation for grazing, crops, forestry, and fruit. The principal crops produced were barley,
potatoes, wheat and oats although a variety of others were also
grown. Due to the climate in Northern Ireland, more vegetables
than fruits were produced, although County Armagh, which lies to
the south of Lough Neagh, was noted for its apple orchards.
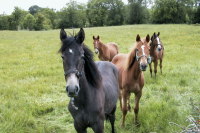
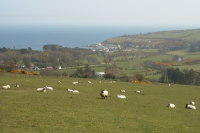
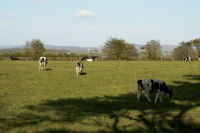
Like the rest of the UK and Ireland, the agricultural industry
in Northern Ireland was affected by the cattle disease BSE,
but fortunately, not to the same extent. In the rest of the UK,
30 percent of cattle herds experienced at least one case of BSE,
whilst in Northern Ireland only 5 percent of herds experienced
at least one case of the disease.
Fishing was also an important industry in Northern Ireland, particularly
in counties Antrim and Down. In 1998, almost twenty-five thousand tonnes of fish were landed at Northern Ireland ports, worth
an estimated £20 million. The busiest harbour in the North
of Ireland was Kilkeel in County Down, where an estimated nine thousand tonnes of fish were landed in 1998.
Sources:
The following tables provide further breakdowns of some of the
agricultural statistics available for Northern Ireland. Much of
this material has been derived from the Northern Ireland Annual
Abstract of Statistics (1996), Regional Trends (1996) and the
Irish Almanac and Yearbook of facts (1997).
Number of Persons working on farms in Northern Ireland, 1991-1997
| |
1991 |
1992 |
1993 |
1994 |
1995 |
1996 |
1997 |
|
Farmers, Partners, Directors (full-time) |
26.0 |
26.0 |
24.8 |
24.6 |
23.5 |
22.7 |
22.4 |
|
Farmers, Partners, Directors (part-time) |
16.1 |
16.5 |
15.3 |
16.5 |
16.3 |
17.2 |
16.8 |
|
All Farmers, Partners, Directors |
42.1 |
42.4 |
40.1 |
41.1 |
39.8 |
39.9 |
39.2 |
|
Spouses of Farmers, Partners, Directors |
5.2 |
4.4 |
6.5 |
6.2 |
6.8 |
6.8 |
7.0 |
|
Other full-time workers (male) |
3.8 |
3.6 |
3.4 |
3.3 |
3.2 |
3.0 |
2.7 |
|
Other full-time workers (female) |
1.1 |
1.0 |
0.6 |
0.4 |
0.4 |
0.4 |
0.3 |
|
Other part-time workers (male) |
2.4 |
2.4 |
2.6 |
2.4 |
2.5 |
2.4 |
2.4 |
|
Other part-time workers (female) |
1.0 |
1.0 |
0.8 |
0.8 |
0.7 |
0.7 |
0.7 |
|
Other casual workers (male) |
7.0 |
7.2 |
8.3 |
8.2 |
8.7 |
8.3 |
8.6 |
|
Other casual workers (female) |
1.0 |
0.9 |
0.8 |
0.8 |
0.8 |
0.9 |
0.9 |
|
All other workers |
16.3 |
16.1 |
16.4 |
15.8 |
16.3 |
15.8 |
15.6 |
|
Labour Force |
63.6 |
62.9 |
6.3 |
63.1 |
63.0 |
62.5 |
61.9 |
(Source: Northern Ireland Annual Abstract of Statistics, 1998, p.140)
Number and Size of Farms by Area in Northern
Ireland, 1994-1998
Number of Farms (1994-1998):
| Number of Farms |
|
1994 |
28,404 |
|
1995 |
27,937 |
|
1996 |
27,547 |
|
1997 |
32,118 |
|
1998 |
31,817 |
Size of Farms (1998):
|
Hectares: |
Number of Farms |
Hectares |
|
0.1 - 9.9 |
7,837 |
41,898 |
|
10.0 - 19.9 |
7,090 |
103,401 |
|
20.0 - 29.9 |
4,871 |
120,130 |
|
30.0 - 49.9 |
5,676 |
219,589 |
|
50.0 - 99.9 |
4,719 |
321,779 |
|
100.0 + |
1,624 |
261,573 |
|
TOTAL |
31,817 |
1,068,370 |
(Source: Irish Almanac and Yearbook of Facts, 2000, p.260)
Land under Cultivation in Northern Ireland, 1994-1998
(1,000 Hectares)
| |
1994 |
1995 |
1996 |
1997 |
1998 |
|
Total Agricultural Crops |
56.1 |
54.9 |
55.0 |
56.6 |
55.9 |
|
Total Horticultural Crops |
3.3 |
3.2 |
3.2 |
3.1 |
3.2 |
|
Total Grass |
813.0 |
817.4 |
819.3 |
825.1 |
830.6 |
|
Grazing |
176.3 |
170.9 |
169.0 |
164.1 |
159.1 |
|
Woods/Plantations |
8.2 |
8.1 |
8.2 |
8.2 |
8.2 |
|
Other Land |
14.7 |
13.2 |
12.9 |
11.8 |
11.3 |
|
Total Area |
1,071.6 |
1,067.8 |
1,067.6 |
1,068.9 |
1,068.4 |
(Source: Irish Almanac and Yearbook of Facts, 2000, p.262)
Earnings (£) and Hours of Agricultural Workers, 1987-1996
| |
1987 |
1988 |
1989 |
1990 |
1991 |
1992 |
1993 |
1994 |
1995 |
1996 |
|
Average weekly earnings (£ per week) |
105.84 |
112.90 |
123.35 |
130.86 |
145.51 |
147.11 |
153.96 |
168.53 |
167.96 |
193.82 |
|
Average weekly hours |
41.91 |
42.04 |
42.17 |
42.22 |
42.44 |
42.08 |
43.09 |
42.84 |
42.63 |
44.00 |
|
Average hourly earnings (£ per hour) |
2.53 |
2.69 |
2.93 |
3.10 |
3.43 |
3.50 |
3.57 |
3.93 |
3.94 |
4.41 |
(Source: Northern Ireland Annual Abstract of Statistics 2000, p.139)
Livestock Figures in Northern Ireland, 1995-1998
(thousand head)
| |
1995 |
1996 |
1997 |
1998 |
|
Total Cattle |
1,699.1 |
1,759.3 |
1,731 |
1,767.3 |
|
Total Sheep |
2,753.6 |
2,753.2 |
2,880.1 |
2,986.6 |
|
Total Pigs |
564.2 |
565.2 |
616.7 |
653.4 |
|
Total Poultry |
16,003.3 |
15,889.5 |
15,607.8 |
15,170.6 |
|
Total Goats |
3.8 |
3.6 |
3.5 |
3.6 |
|
Total Horses and Ponies |
9.6 |
9.8 |
9.9 |
9.8 |
(Source: Irish Almanac and Yearbook of Statistics, 2000, p.263)
Weight and Estimated Value of Landed
Fish in Northern Ireland, 1994-1998
|
. |
Tonnes |
Value (£) |
|
1994 |
20,879.82 |
18,009,460 |
|
1996 |
27,850.06 |
19,409,389 |
|
1998 |
24,956.51 |
20,243,214 |
(Source: Irish Almanac and Yearbook of Statistics, 2000, p.268)
|